I. Psychology is the science of human behavior because we want to:
A. To get facts rather than opinions.
Websites for fact-checking
- Snopes
- FactCheck.org
- Consumer reports Mostly for products
B. To get good information so we help--rather than hurt--people. Wouldn't it be nice if everyone in the health field used the same approach? Unfortunately, they don't.
To see how well you understand the scientific approach, see how many
points you can get in this psychological
scientist game.
(To play the game, click on the word "game" above)
To learn more about research methods, click on the section you want to learn more about.
II. There are two types of information that we want. That is, there are two types of questions we want answered:
B. Explanation/Understanding/Control: "Why?"
| Description/Prediction | Explanation/ Control |
| What are people doing or thinking? | What causes (influences, makes) people to do or think what they do? |
| What is happening? | Why is it happening? |
| What do people do in a certain situation? | How can manipulating drugs, situations, or instructions change people's behavior? |
| Answered only by non-experimental/ descriptive/correlational research. | Answered only by using experiments. |
Click here to get practice on this key distinction
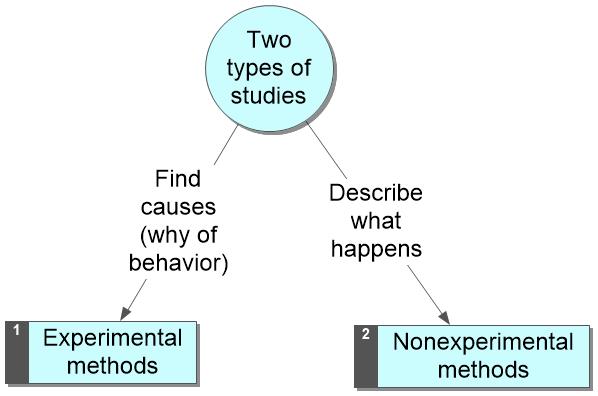
III. Nonexperimental methods describe behavior, but do not let us identify the causes or reasons for the behavior.
Tutorial to help you understand the correlational data does not allow you to make cause-effect conclusions.
Although correlational methods do not allow cause-effect statements, they allow you to accurately describe behavior--when correctly executed and interpreted.
Why you may be biased against nonexperimental methods
Common misuse of the term "experiment" to mean any scientific study. Remember, "nonexperimental" does not mean nonscientific!
Our society's emphasis on causal explanations: We like experimental methods because we want to know why things happen and how to change things. However, nonexperimental methods also tell us important things--what people do and think.
Tutorial to help you understand the correlational data does not allow you to make cause-effect conclusions.
Why you should like nonexperimental methods
They are useful when you
1. Can't do an experiment because you can't manipulate the predictor variable. Ex: You can't manipulate participants' gender or age.
2. Can't ethically do an experiment because you can't ethically manipulate the predictor variable (e.g., illness, poverty)
3. Want to describe or predict behavior
They are similar to what you do every day.
You watch people and ask people questions.
They are the backbone of many fields
(such as astronomy, ecology, medical science, metereology, political science, fields that emphasize describing and predicting behavior)
Take time out for an ungraded quiz
IV. Common types of correlational methods
A. Observation:Useful for describing behavior and for suggesting causal hypotheses that could be tested in experiments.
1. Scientific observation should be
a. Objective: "just the facts"
take special care to avoid anthropomorphism (also known as the anthropomorphic fallacy):
giving animals human characteristics (warmth, genius, etc.) without objective evidence.
b. Systematically record data to avoid memory biases and errors, such as those caused by the availability heuristic
c. Use good, fair sample if you are going to generalize your results.
2. Difficulties with observation--It can sometimes be:
a. Impossible: Can we observe thoughts?
b. Impractical: Do you want to wait to observe a robbery?
c. Unethical: How does observation differ from spying?
3. Uses
B. Surveys and Tests
* What people say, not what they do for four reasons
- Social desirability bias: People may try to make themselves look better than they are. In other words, they lie.
- Obeying demand characteristics: People may say what they think we want to hear.
- Memory errors: Do people accurately remember what they do?
- As revealed by Nisbett and Wilson's findings, people don't always know why they do things.
* Only as good as questions.
Two types of bad questions:
- Leading questions, which "lead" respondents to the "correct" response. These questions make it quite clear to respondents what answer the researcher wants them to give.
Ex: "You like my website, right?"Note that some leading questions may lead to increasing the social desirability bias.
- Confusing questions: Questions that are too long, use too many " and's," "or's," "but's,""no's," "not's," or big words.
* Only as good as sample.
Two factors help you have a good sample.
- Large sample. Having a large sample is a good start, but, by itself, is not enough to guarantee a good sample. A big sample can be a bad sample.
- Random sampling: a system where the sample should be similar to the larger group because every member of the larger group has an equal chance of being chosen to be in the study.
C. Case study
1. Learn from unique or extreme
a. Unique
b. Extreme
2. Problems in drawing conclusions from case studies
- Using a small, nonrandom sample means you can't generalize the results to other individuals
- Lack of control group means you can't make cause effect statements because things might have turned out the way they did even without the treatment.
Click here to take this ungraded quiz
V. Facts about all correlational methods
A. They do tell you whether 2 variables are related. But they do not tell you which variable influences which. They may hint or suggest that one variable influences another, but they are never proof of causality. That is, they are never proof that changes in variable A causechanges in variable B.
That is, if variable A and variable B are correlated, you can't know which variable influences which. Why not?
Because the variables could be statistically related for any one of the following 3 reasons--and you have no way to
know which of these reasons is the correct one:
1. A causes (influences, affects) B
See this possibility for the relationship between the moods of two people (Person A and Person B).
2. B causes (influences, affects,changes) A
[thus, if you concluded that A-->B, you mightbe confusing effects for causes]
See this possibility for the relationship between the moods of two people (Person A and Person B).
This poor woman apparently made the mistake of confusing cause for effects -- and now people are making fun of her (admittedly, this is pretty funny)
3. C causes both A and B.
That is, some other factor influences both A and B, but there is no direct relationship between A and B. In other words, A doesn't influence B, B doesn't influence A, but some other factor ("C") influences both of them. [Thus, if you concluded that A-->B or that B-->A, you might be ignoring the fact that you are really looking at two effects of some other cause].See this possibility for the relationship between the moods of two people.B. The language of correlations. Correlation coefficients
can range from -1.00 to +1.00. The correlation coefficient contains two pieces of information:
- One piece is the sign (positive or negative),
- the other piece is the number itself.
1. The sign of the correlation indicates the kind or type of relationship(but not the strength of the relationship)
a. Positive correlations
the more ___ (fill in the blank with a variable, e.g. height), the more ____ (fill in the blank with another variable, e.g., weight)
the less ____(fill in the blank with a variable, e.g. height), the less ____(fill in the blank with a different variable, e.g., weight)
b. Zero correlations: no relationship
c. Negative correlations: reverse
the more ____ (fill in the blank with a variable, e.g., stress), the less _____ (fill in the blank with another variable, e.g., happiness)the less _____(fill in the blank with a variable, e.g., stress), the more _____(fill in the blank with another variable, e.g., happiness)
2. The further away from zero, the stronger the relationship.
- Counter-intuitive implications for comparing positive and negative correlations
- -.9 is a stronger correlation than +.7
- -.2 is a stronger correlation than 0
Review of Correlational Methods
Nice tool for reviewing key research terms from "The Psych Files."
By now, you should be able to:
- Explain why psychologists want to use the scientific approach.
- Give an example of a descriptive/predictive question and an example of a
causal question. Then, explain the difference between the two types of
questions.
- Explain how anthropomorphism illustrates the difficulty of being objective in one's observations.
- List three differences between informal observation and scientific
observation.
- List four reasons why what people say in response to a survey may not be the truth.
- Explain why the case study is not as scientifically valid as a survey.
- Describe the three main problems with surveys and explain what the worst ofthese problems is.
- Explain why "correlation does not mean causation."
- Explain the difference between a positive correlation and a negative
correlation.
- Explain why a -.90 correlation indicates a much stronger relationship than a +.60 correlation.
- Do well on this quiz which explores your understanding of the relationship between correlation and causality.
- Do well on this quiz which tests your general understanding of correlation coefficients and correlational methods.
THE EXPERIMENT: A Tool for Allowing Us to Determine Whether "A" Causes Changes in "B."
Definition of the simple experiment: a research tool that allows scientists to find out whether a treatment influences (causes) a given behavior or mental characteristic by randomly assigning some participants to get the treatment and other participants to not receive the treatment.
Brief overview of the Simple Experiment
| No treatment group | Average Score |
| Treatment group | Average Score |
| No caffeine group | 15 seconds |
| Caffeine group | 9 seconds |
Why do we do experiments?
To make cause-effect statements.
Two types of hypotheses:
1. Experimental hypothesis: prediction that the
treatment causes an effect. It can be proven wrong.
2. Null hypothesis: prediction that the treatment does not cause an effect. It also can be proven wrong. It cannot, however, be accepted.
Joke illustrating problem of accepting the null hypothesis.
More serious problem that could result from accepting the null hypothesis.
What happens if we disprove the null hypothesis?
(Hint: If the statement "I did not eat the candy bar" is false, what did I do?)
Why do we have two groups?
(Hint: In the Skinner experiment with the rats running the mazes, what could we have concluded if we had only used a caffeine group. That is, what could we have concluded about the effects of caffeine if all we knew was that the rats getting caffeine ran the maze in 9 seconds?)
How can we avoid comparing apples with oranges?
(How do we know that our treatment group and control group were similar before we introduced the treatment?)
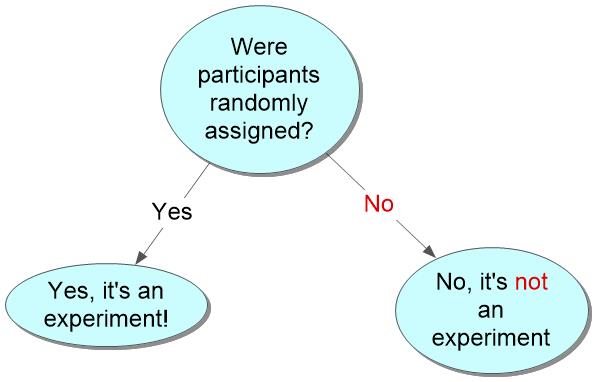
Random assignment to treatment involves using a
system where everyone who participates in the study has
an equal chance of being put into the treatment group.
Time to take an ungraded quiz.
What's the problem with random assignment?
Hint: Suppose we get these results:
Experimental Group = 75%
Control Group = 74%
Could these results be due to random assignment creating groups that were slightly different before we introduced the treatment?
How can this problem be solved?
Tests of statistical significance determine if the difference is to big to be due to chance alone
The tests look at two factors:
1. They look at the size of the difference.The bigger the difference between the groups, the more likely the results are to be statistically significant. For example, if the Experimental group averages 95% and the control group averages 45% on our test, that difference would probably be statistically significant. (Intuitively, you do the same thing. If your team gets beat by one point, you point out that the other team was lucky. You don't have to concede that the other team is better. However, if they beat your team by 30 points, you may have to admit that the other team is better).
2. They look at the number of participants.The more participants that are used, the more likely the results are to be statistically significant. (Why? Because if you only have a few participants, the groups might be very different at the beginning of the study. However, if you have 100 participants in each group, the groups should be pretty similar before the start of the study. If they are very similar at the start, then, if they are even slightly different at the end, that difference could be due to the treatment. Similarly, in sports, if one team beats another in a seven game series that's more convincing evidence of the team's superiority than winning a single game.)
Two possible verdicts from statistical tests
1. statistically significant:you are sure beyond a reasonable doubt (your doubt is less than 5%) that the difference between your groups is too big to be due to chance alone.
So, if the difference between the treatment group and the no-treatment group is too big to be due to chance alone, then some of that difference is probably due to treatment. In other words, the treatment probably had an effect.
2. not statistically significant:
you are not sure, beyond a reasonable doubt, that the difference between the groups is due to anything more than just chance.
So, you can't conclude anything. The results are inconclusive.
Time to take a time out to test your understanding of statistical significance.
Conclusions about the Experiment
The goal of the simple experiment:
is to find the causes of behavior. That is, the goal is to find rules that will allow us to understand and control behavior.
Why the simple experiment can accomplish that goal:
it uses random assignment. Random assignment accomplishes two things:
- It makes the groups similar before the start of the experiment
- It allows us to use statistics to determine how unlikely it is that the differences between the groups at the end of the experiment are due to chance alone. If it is extremely unlikely that the results are due to chance alone, we conclude that the treatment was at least partly responsible for the differences between the two groups.
Implications of the fact that the experiment depends on random assignment:
- Much research, even that done in labs, is not experimental research because it does not involve randomly assigning people to groups.
- Some field research is experimental because it involves randomly assigning people to groups.
- We have to do statistical tests to see if our treatment had an effect. We can't just say the treatment had an effect because the treatment group scored higher than the control group. We have to do statistics to see whether this difference was (probably) too big to be just a coincidence.
Take another ungradedquiz.
Review of the Simple Experiment
- Explain why there are certain research questions that cannot be answered by
using an experiment.
- Explain why the case study illustrates the value of having a control
group.
- Explain why the null hypothesis can't be proven right.
- Explain why researchers use double-blind techniques.
- Explain why only experiments can answer causal questions.
- Explain why a good hypothesis is one that could be disproven.
- Explain the difference between an independent variable and a dependent
variable.
- State a rule for knowing whether a study that uses two groups is
an experiment. State two implications of that rule.
- Explain why the following statement is false: "To find out if the treatment
had an effect, simply see if the treatment group scored differently than the
no-treatment group."
- Explain what it means if the results are statistically significant.
- Explain what you can conclude if the results are not statistically
significant.
- Explain why the simple experiment is better than the before-after study.
- Explain the difference between random assignment and random sampling.
- Explain why you can't scientifically study the effects of race, gender, or
personality.
- Take this quiz until you can easily get 100% on it.
- One last quiz on experiments
READING ABOUT PSYCHOLOGY IN THE POPULAR PRESS: A SHORT COURSE IN UNCOMMONLY GOOD SENSE
I. Overview: Why understand research methods?
A. Understanding research is critical to understanding psychology
B. Thinking like a researcher is a marketable skill
C. Understanding research is crucial for being an intelligent consumer of information
II. Questions to ask
A. Is prediction testable like experimental hypothesis or is their prediction untestable because:
1. It is too vague
2. They are trying to prove null hypothesis
B. What is the source of the information?
"Who says?"
C. Is this an oversimplification?
D. How consistently do the results occur? (if there are results!)
1. Beware of argument by example--the lesson of the case study & also the survey.
2. Look for statistical significance,
but realize that statistical significance does not necessarily mean large or important
E. Ask about control groups (lesson from the experiment)
1. Is there one --or are they assuming they know what the control group would do?
Is it a group?
2. Is it fair?
a. Was it established by random assignment?
b. Is it treated like the treatment group in every respect except that it doesn't get the treatment?
c. Were double-blind techniques used? If not, the results could be due to a placebo effect.
F. Are they trying to insinuate that correlation means causation? Remember, A-->B is only one of several possibilities for a statistical relationship between A and B.
G. Are they reporting what they actually saw
or
are they reporting their interpretation of what they saw?
(The lesson of observation)
H. Are their results based on a sample that would apply to you?
(The lesson of the survey)