Scroll down through these 3 graphs to see if you can quickly and accurately identify main effects and interactions.
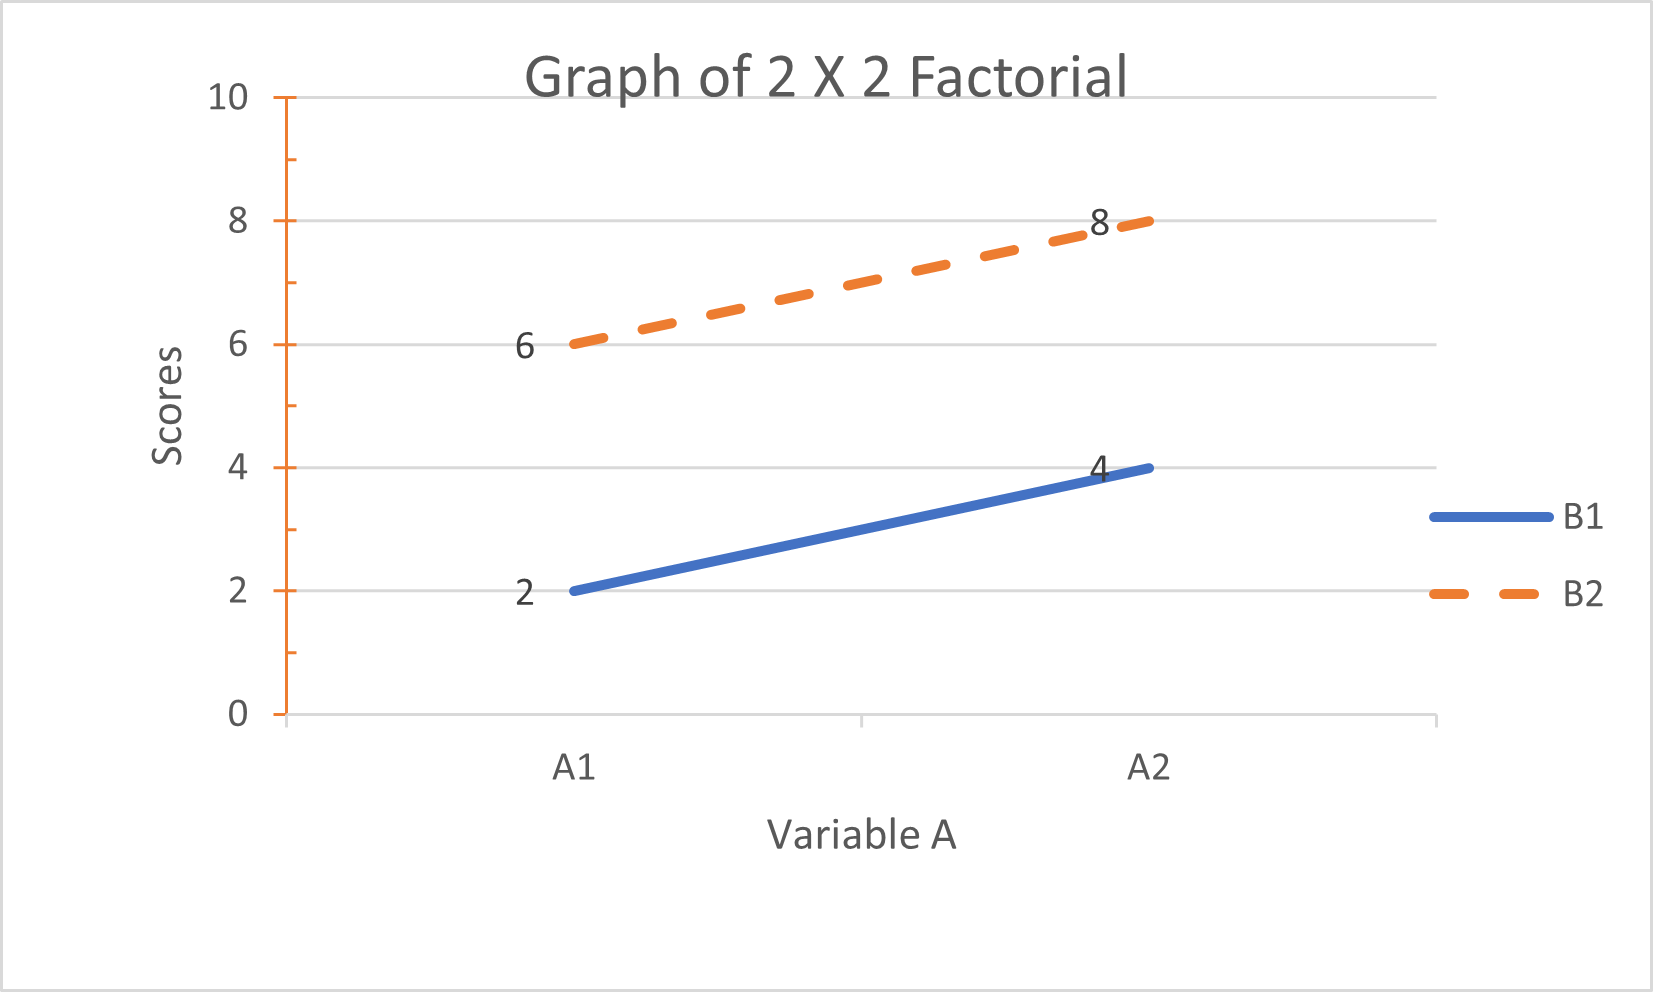
Main effect for A?
Yes, the average height of the lines on left (A1) side of the graph is different from the average height of the lines on the right (A2) side.
In this case, both lines slope up as they go from A1 to A2
Main effect for B?
Yes, the average height of the two lines is different
(i.e., their midpoints are at different points). In this case, the B2 line is higher than the B1 line.
Interaction?
No, because the lines are parallel--that is, the effect of going from A1 to A2 is the same (+2) for both the B1 and the B2 lines.
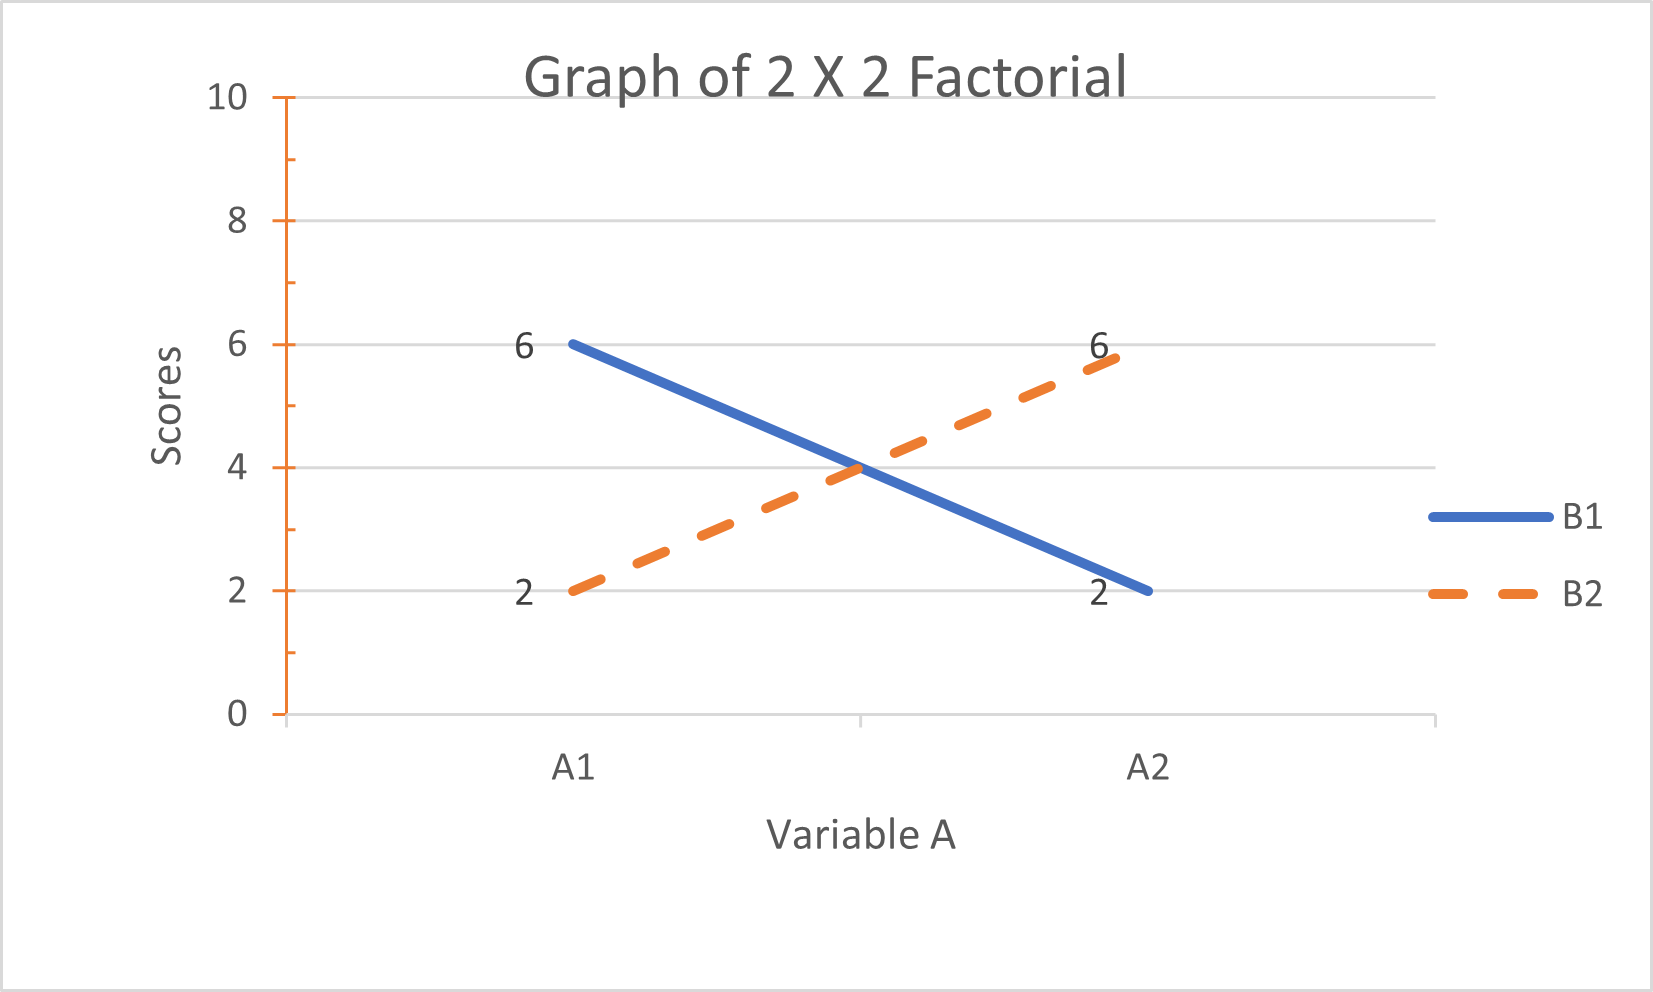
Main effect for A?
No, if we combined the B1 and B2 lines into one line, that line would not slope up or down as it went from A1 to A2.
Main effect for B?
No, the average height of the B1 and B2 lines is the same. Put another way, the B1 and B2 lines have the same midpoint.
Interaction?
Yes, because the lines are not parallel. Indeed, we have a cross-over interaction.
Note that the lines cross over because the effect of going from A1 to A2 in condition B1 is the opposite
of the effect of going from A1 to A2 for condition B2.
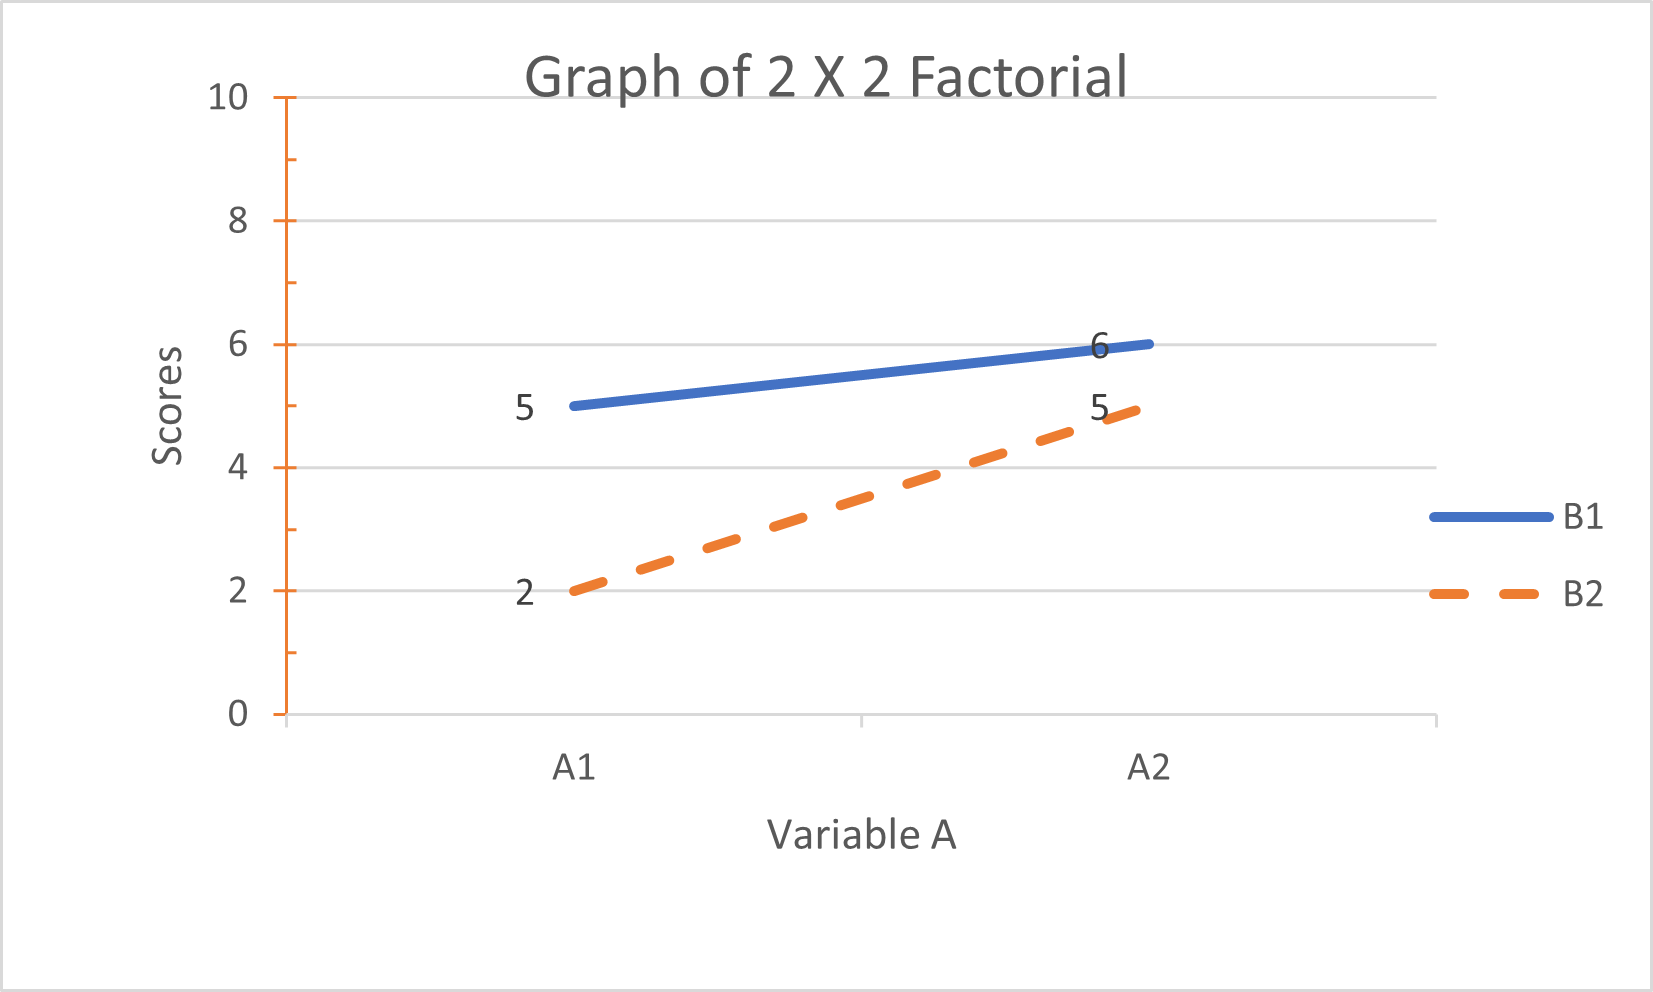
Main effect for A?
Yes, if we combined the B1 and B2 lines into one line, that line would slope up
as it went from A1 to A2.
Main effect for B?
Yes, the B1 line is above the B2 line, suggesting that varying B has an effect.
Interaction?
Yes, because the lines are not parallel.
Indeed, we have an ordinal interaction.
The B2 groups appear to be more affected by the A manipulation. We say "appears"
because, if we have ordinal data, the A manipulation might not have a stronger effect on the B2 groups. That is, the A manipulation has a stronger psychological effect on the B2 groups
if-psychologically--the difference between 2 and 5 on our scale is greater than the
difference between 5 and 6. However, if that is not true--which could be the
case if we have ordinal data--then the A manipulation would not have a greater psychological effect
on the B2 groups than on the B1 groups.