No Caffeine |
Caffeine | |
No Calorie |
1 |
2 |
Calorie |
3 |
4 |
(Group 1) Average for no-calorie/no-caffeine group =
(Group 2) Average for no-calorie/caffeine group =
(Group 3) Average for calorie/no-caffeine group =
(Group 4) Average for calorie/caffeine group =
Which groups would we compare to find out:
1. Whether varying calories in decaffeinated drinks has an effect?
2. Whether varying calories in caffeinated drinks has an effect?
3. Whether varying caffeine in diet drinks has an effect?
4. Whether varying caffeine in "regular" (non-diet) drinks has an effect?
No Caffeine |
Caffeine | |
No Calorie |
5 |
7 |
Calorie |
5 |
7 |
Average for calorie/no-caffeine group =
Average for no-calorie/no-caffeine group =
Estimated simple main effect of calories in the no-caffeine groups =
It seems that calories, for the no-caffeine groups, (circle one):
increases energy level
decreases energy level
has no demonstrated effect on energy level
Average for calorie/caffeine group =
Average for no-calorie/caffeine group =
Estimated simple main effect of calories in the caffeine groups =
It seems that calories, for the caffeine groups, (circle one):
increases energy level
decreases energy level
has no demonstrated effect on energy level
Average of calorie groups =
Average of no-calorie groups =
Estimated overall main effect of calories =
Average of the two calorie simple main effects=
Average for caffeine/no- calorie group =
Average for no-caffeine/no-calorie group =
Estimated simple main effect of caffeine for the no-calorie groups =
It seems that caffeine, for the no-calorie groups, (circle one):
increases energy level
decreases energy level
has no demonstrated effect on energy level
Average for caffeine/calorie group =
Average for no-caffeine/calorie group =
Estimated simple main effect of caffeine in the calorie groups =
It seems that caffeine, for the calorie groups, (circle one):
increases energy level
decreases energy level
has no demonstrated effect on energy level
Average of caffeine groups =
Average of no caffeine groups =
Estimated overall main effect of caffeine =
Average of the two caffeine simple main effects =

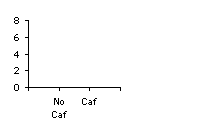
Graph the first row of the table (the "No Calorie" groups) and label that line
"No Calorie"
Does the line slope up, stay even, or slope down?
Does caffeine seem to increase, have no effect, or decrease energy level in the
no-calorie groups?
No Caffeine |
Caffeine | |
No Calorie |
6 |
6 |
Calorie |
8 |
8 |
Average for calorie/no-caffeine group =
Average for no-calorie/no-caffeine group =
Estimated simple main effect of calories in the no-caffeine groups =
It seems that calories, for the no-caffeine groups, (circle one):
increases energy level
decreases energy level
has no demonstrated effect on energy level
Average for calorie/caffeine group =
Average for no-calorie/caffeine group =
Estimated simple main effect of calories in the caffeine groups =
It seems that calories, for the caffeine groups, (circle one):
increases energy level
decreases energy level
has no demonstrated effect on energy level
Average of calorie groups =
Average of no-calorie groups =
Estimated overall main effect of calories =
Average of the two calorie simple main effects=
Average for caffeine/no- calorie group =
Average for no-caffeine/no-calorie group =
Estimated simple main effect of caffeine for the no-calorie groups =
It seems that caffeine, for the no-calorie groups, (circle one):
increases energy level
decreases energy level
has no demonstrated effect on energy level
Average for caffeine/calorie group =
Average for no-caffeine/calorie group =
Estimated simple main effect of caffeine in the calorie groups =
It seems that caffeine, for the calorie groups, (circle one):
increases energy level
decreases energy level
has no demonstrated effect on energy level
Average of caffeine groups =
Average of no caffeine groups =
Estimated overall main effect of caffeine =
Average of the two caffeine simple main effects=
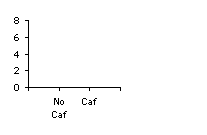
Graph the first row of the table (the "No Calorie" groups) and label that line
"No Calorie"
Graph the second row of the table (the "Calorie" groups) and label that line
"Calorie"
Is the "Calorie" line above, even with, or below the "No Calorie" line?
Do calories seem to increase, have no effect on, or decrease energy level?
Do the two lines slope up, stay even, or slope down?
Does caffeine seem to increase, have no effect, or decrease energy levels?
Are the two lines parallel?
No Caffeine |
Caffeine | |
No Calorie |
8 |
8 |
Calorie |
6 |
6 |
Average of calorie groups =
Average of no-calorie groups =
Estimated overall main effect of calories =
Average of caffeine groups =
Average of no caffeine groups =
Estimated overall main effect of caffeine =
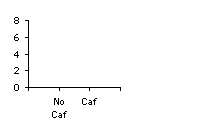
Graph the first row of the table (the "No Calorie" groups) and label that line
"No Calorie"
Graph the second row of the table (the "Calorie" groups) and label that line
"Calorie"
Is the "Calorie" line above, even with, or below the "No Calorie" line?
Do calories seem to increase, have no effect on, or decrease energy level?
Do the two lines slope up, stay even, or slope down?
Does caffeine seem to increase, have no effect, or decrease energy level?
Are the two lines parallel?
No Caffeine |
Caffeine | |
No Calorie |
0 |
6 |
Calorie |
2 |
8 |
Average for calorie/no-caffeine group =
Average for no-calorie/no-caffeine group =
Estimated simple main effect of calories in the no-caffeine groups =
It seems that calories, for the no-caffeine groups, (circle one):
increases energy level
decreases energy level
has no demonstrated effect on energy level
Average for calorie/caffeine group =
Average for no-calorie/caffeine group =
Estimated simple main effect of calories in the caffeine groups =
It seems that calories, for the caffeine groups, (circle one):
increases energy level
decreases energy level
has no demonstrated effect on energy level
Average of calorie groups =
Average of no-calorie groups =
Estimated overall main effect of calories =
Average of the two simple main effects of calories =
Average for caffeine/no- calorie group =
Average for no-caffeine/no-calorie group =
Estimated simple main effect of caffeine for the no-calorie groups =
It seems that caffeine, for the no-calorie groups, (circle one):
increases energy level
decreases energy level
has no demonstrated effect on energy level
Average for caffeine/calorie group =
Average for no-caffeine/calorie group =
Estimated simple main effect of caffeine in the calorie groups =
It seems that caffeine, for the calorie groups, (circle one):
increases energy level
decreases energy level
has no demonstrated effect on energy level
Average of caffeine groups =
Average of no caffeine groups =
Estimated overall main effect of caffeine =
Is the average of the two simple caffeine main effects equal to the overall main effect of caffeine? YES NO
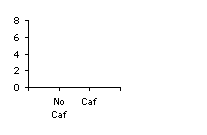
Graph the first row of the table (the "No Calorie" groups) and label that line
"No Calorie"
Graph the second row of the table (the "Calorie" groups) and label that line "Calorie"
Is the "Calorie" line above, even with, or below the "No Calorie" line?
Do calories seem to increase, have no effect on, or decrease energy level?
Do the two lines slope up, stay even, or slope down?
Does caffeine seem to increase, have no effect, or decrease energy level?
Are the two lines parallel? YES NO
No Caffeine |
Caffeine | |
No Calorie |
2 |
4 |
Calorie |
6 |
8 |
Average for calorie/no-caffeine group =
Average for no-calorie/no-caffeine group =
Estimated simple main effect of calories in the no-caffeine groups =
It seems that calories, for the no-caffeine groups, (circle one):
increases energy level
decreases energy level
has no demonstrated effect on energy level
Average for calorie/caffeine group =
Average for no-calorie/caffeine group =
Estimated simple main effect of calories in the caffeine groups =
Are the two calorie simple main effects the same?
It seems that calories, for the caffeine groups, (circle one):
increases energy level
decreases energy level
has no demonstrated effect on energy level
Average of calorie groups =
Average of no-calorie groups =
Estimated overall main effect of calories =
The average of the two simple main effects for calories=
Average for caffeine/no- calorie group =
Average for no-caffeine/no-calorie group =
Estimated simple main effect of caffeine for the no-calorie groups =
It seems that caffeine, for the no-calorie groups, (circle one):
increases energy level
decreases energy level
has no demonstrated effect on energy level
Average for caffeine/calorie group =
Average for no-caffeine/calorie group =
Estimated simple main effect of caffeine in the calorie groups =
It seems that caffeine, for the calorie groups, (circle one):
increases energy level
decreases energy level
has no demonstrated effect on energy level
Average of caffeine groups =
Average of no caffeine groups =
Estimated overall main effect of caffeine =
Is the average of the two caffeine simple main effects equal to the overall main effect for caffeine? YES NO
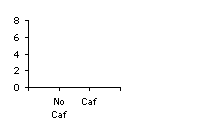
Graph the first row of the table (the "No Calorie" groups) and label that line
"No Calorie"
Graph the second row of the table (the "Calorie" groups) and label that line
"Calorie"
Is the "Calorie" line above, even with, or below the "No Calorie" line?
Do calories seem to increase, have no effect on, or decrease energy level?
Do the two lines slope up, stay even, or slope down?
Does caffeine seem to increase, have no effect, or decrease energy level?
Are the two lines parallel?
No Caffeine |
Caffeine | |
No Calorie |
2 |
4 |
Calorie |
6 |
10 |
Average for calorie/no-caffeine group =
Average for no-calorie/no-caffeine group =
Estimated simple main effect of calories in the no-caffeine groups =
It seems that calories, for the no-caffeine groups, (circle one):
increases energy level
decreases energy level
has no demonstrated effect on energy level
Average for calorie/caffeine group =
Average for no-calorie/caffeine group =
Estimated simple main effect of calories in the caffeine groups =
Are the two calorie simple main effects the same?
It seems that calories, for the caffeine groups, (circle one):
increases energy level
decreases energy level
has no demonstrated effect on energy level
Average of calorie groups =
Average of no-calorie groups =
Estimated overall main effect of calories =
Average of the two calorie simple main effects =
Average for caffeine/no- calorie group =
Average for no-caffeine/no-calorie group =
Estimated simple main effect of caffeine for the no-calorie groups =
It seems that caffeine, for the no-calorie groups, (circle one):
increases energy level
decreases energy level
has no demonstrated effect on energy level
Average for caffeine/calorie group =
Average for no-caffeine/calorie group =
Estimated simple main effect of caffeine in the calorie groups =
It seems that caffeine, for the calorie groups, (circle one):
increases energy level
decreases energy level
has no demonstrated effect on energy level
Average of caffeine groups =
Average of no caffeine groups =
Estimated overall main effect of caffeine =
Average of the two simple caffeine main effects=
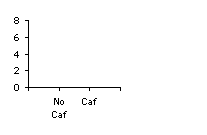
Graph the first row of the table (the "No Calorie" groups) and label that line
"No Calorie"
Graph the second row of the table (the "Calorie" groups) and label that line
"Calorie"
Is the "Calorie" line above, even with, or below the "No Calorie" line?
Do calories seem to increase, have no effect on, or decrease energy level?
Do the two lines slope up, stay even, or slope down?
Does caffeine seem to increase, have no effect, or decrease energy level?
Are the two lines parallel?
A1 |
A2 | |
B1 |
1 |
2 |
B2 |
3 |
6 |
Estimated simple main effect of A in the B1 groups =
Estimated simple main effect of A in the B2 groups =
Estimated overall main effect of A =
Estimated simple main effect of B in the A1 groups =
Estimated simple main effect of B in the A2 groups =
Estimated overall main effect of B =
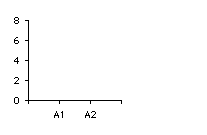
Graph the data from the table.
What does the fact that the B2 line is above the B1 line tell you?
What does the fact that the lines slope up as they go from A1 to A2 tell
you?
What does the fact that the lines are not parallel tell you?
(Hint: Is the effect of B different in the A1 groups than in the A2 groups?)